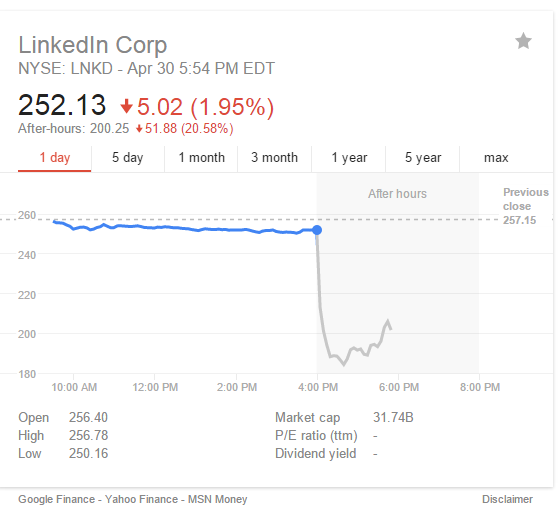
The graphic shows the market behavior of LinkedIn’s stock price late afternoon of 2015-04-30. Did your analytics engine (What’s an analytics engine? See International Institute for Analytics) predict this? If not, what (big?) data were you missing?
If not, chances are, yours was a Big Data Variety problem. Correlating with, for example, only Facebook, Pinterest and other social media platforms may have been a tipoff, but not enough to forecast a 25% single day plunge.
And before you reach for the “Sell” button, you might want to revisit this two-year-old story on Forbes, when the stock price also fell. Did your analytics take that into account? The loss was less dramatic, but the cause was similar.
You may need data from other sources, and more than just sniffing URLs from corporate PR departments a la Selerity. Perhaps your forecasting engine treated that as just a day’s or a quarter’s data point, without consideration of the underlying cause. A mix of complex event processing combined with other types of machine intelligence might have had better results.
Leave a Reply